Profile Inspector v1.2
This location is for Registered Users Only.
Perhaps you need to login or register.
13.1, 12.2, 11.3 or later
Linux, Mac, Windows
README.md
1. Profile Inspector
A Nuke plugin that lets you visualize the profiling information in a more convenient and user-friendly manner.
1.1. NOTE
The plugin is mainly a case study for PySide2 and is still in early development. Also, documentation is not present, as things could change.
1.2. Installation
- Download the repository via the releases page or by cloning it from GitHub.
- Move the folder inside your ~/.nuke directory or into a custom one.
- Write
import ProfileInspectorinto your menu.py.
NOTES
- If you use a custom plugin path, add the path in your
init.py:nuke.pluginAddPath('custom/path') - The folder name must be ProfileInspector.
1.3. Usage
1.3.1. Dag tab
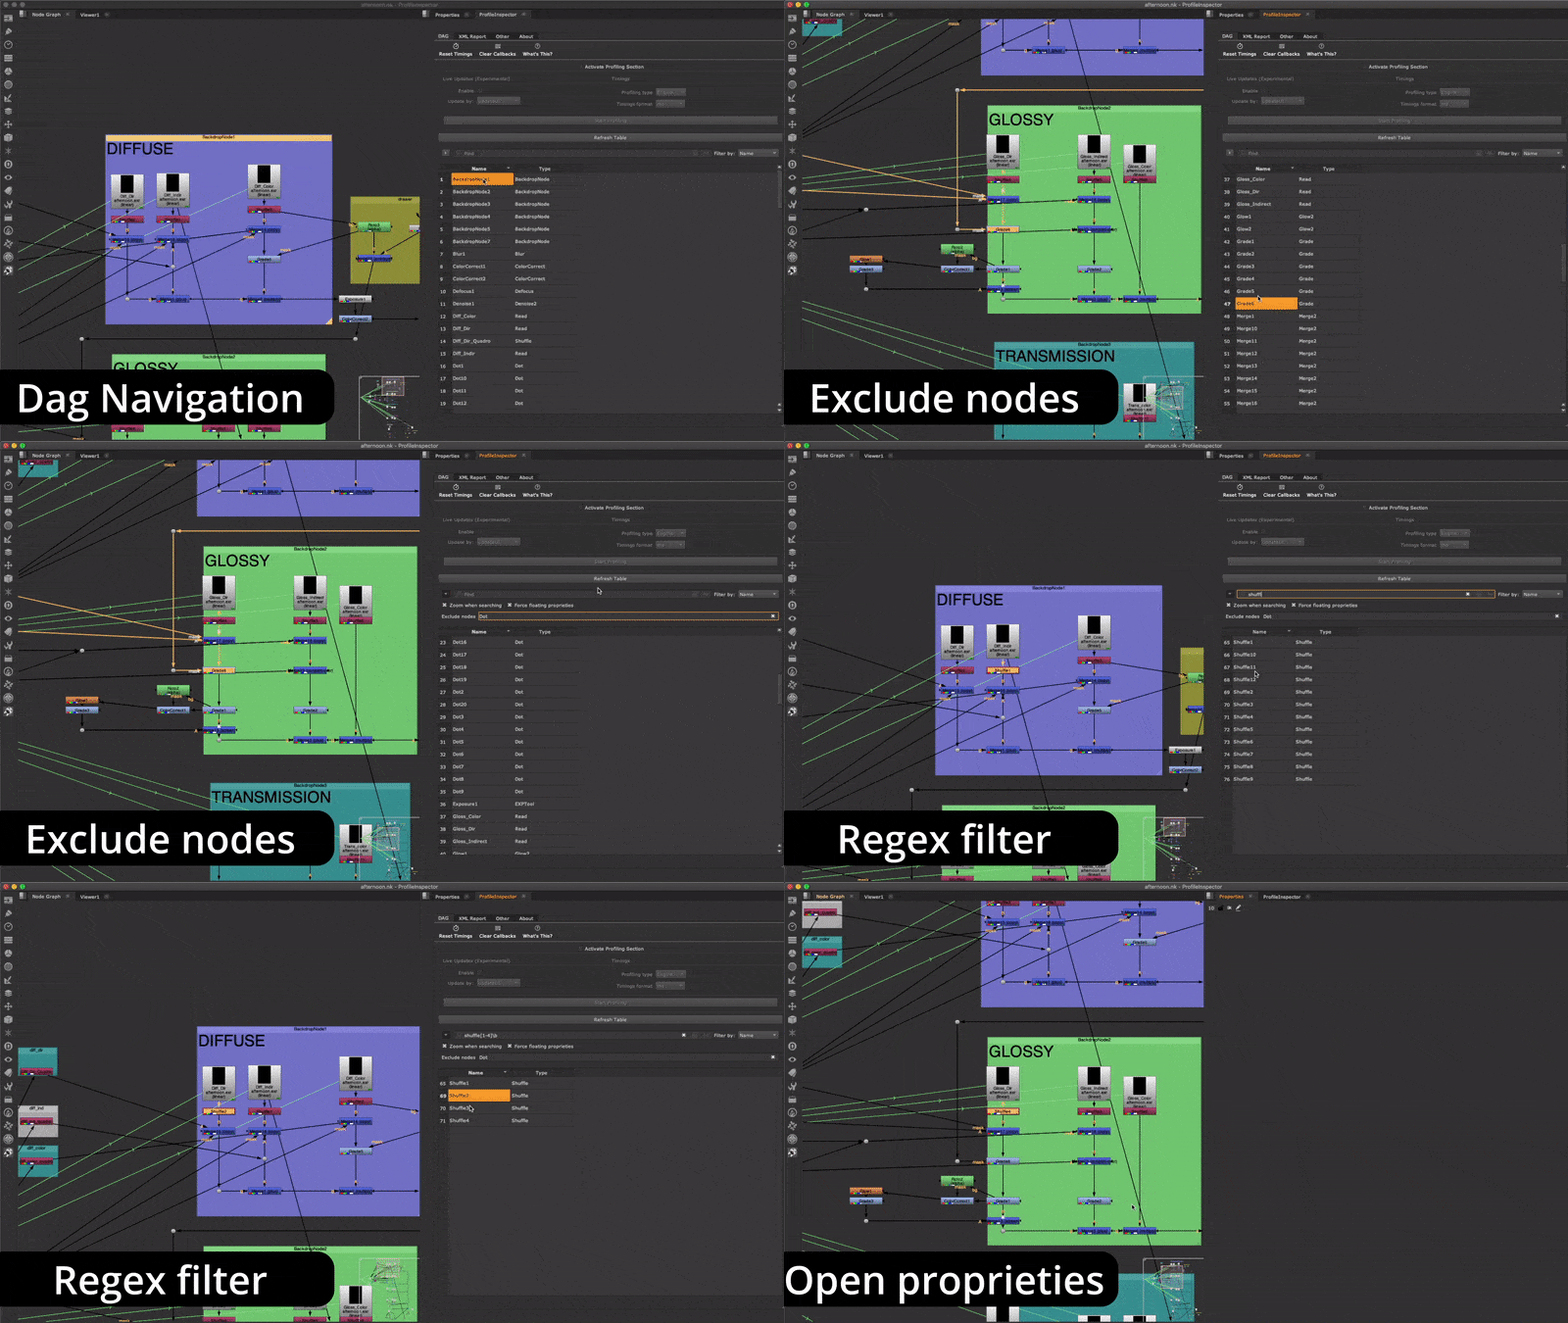
You can use the DAG tab for two reasons:
- To quickly navigate between the nodes.
- To inspect the node's profiling information.
Navigate the DAG
- You can live filter the nodes using a regex pattern.
- Searching a node from the table will automatically center the DAG view on the first node that matches the search.
- You can click on a node name inside the table to open its property panel.

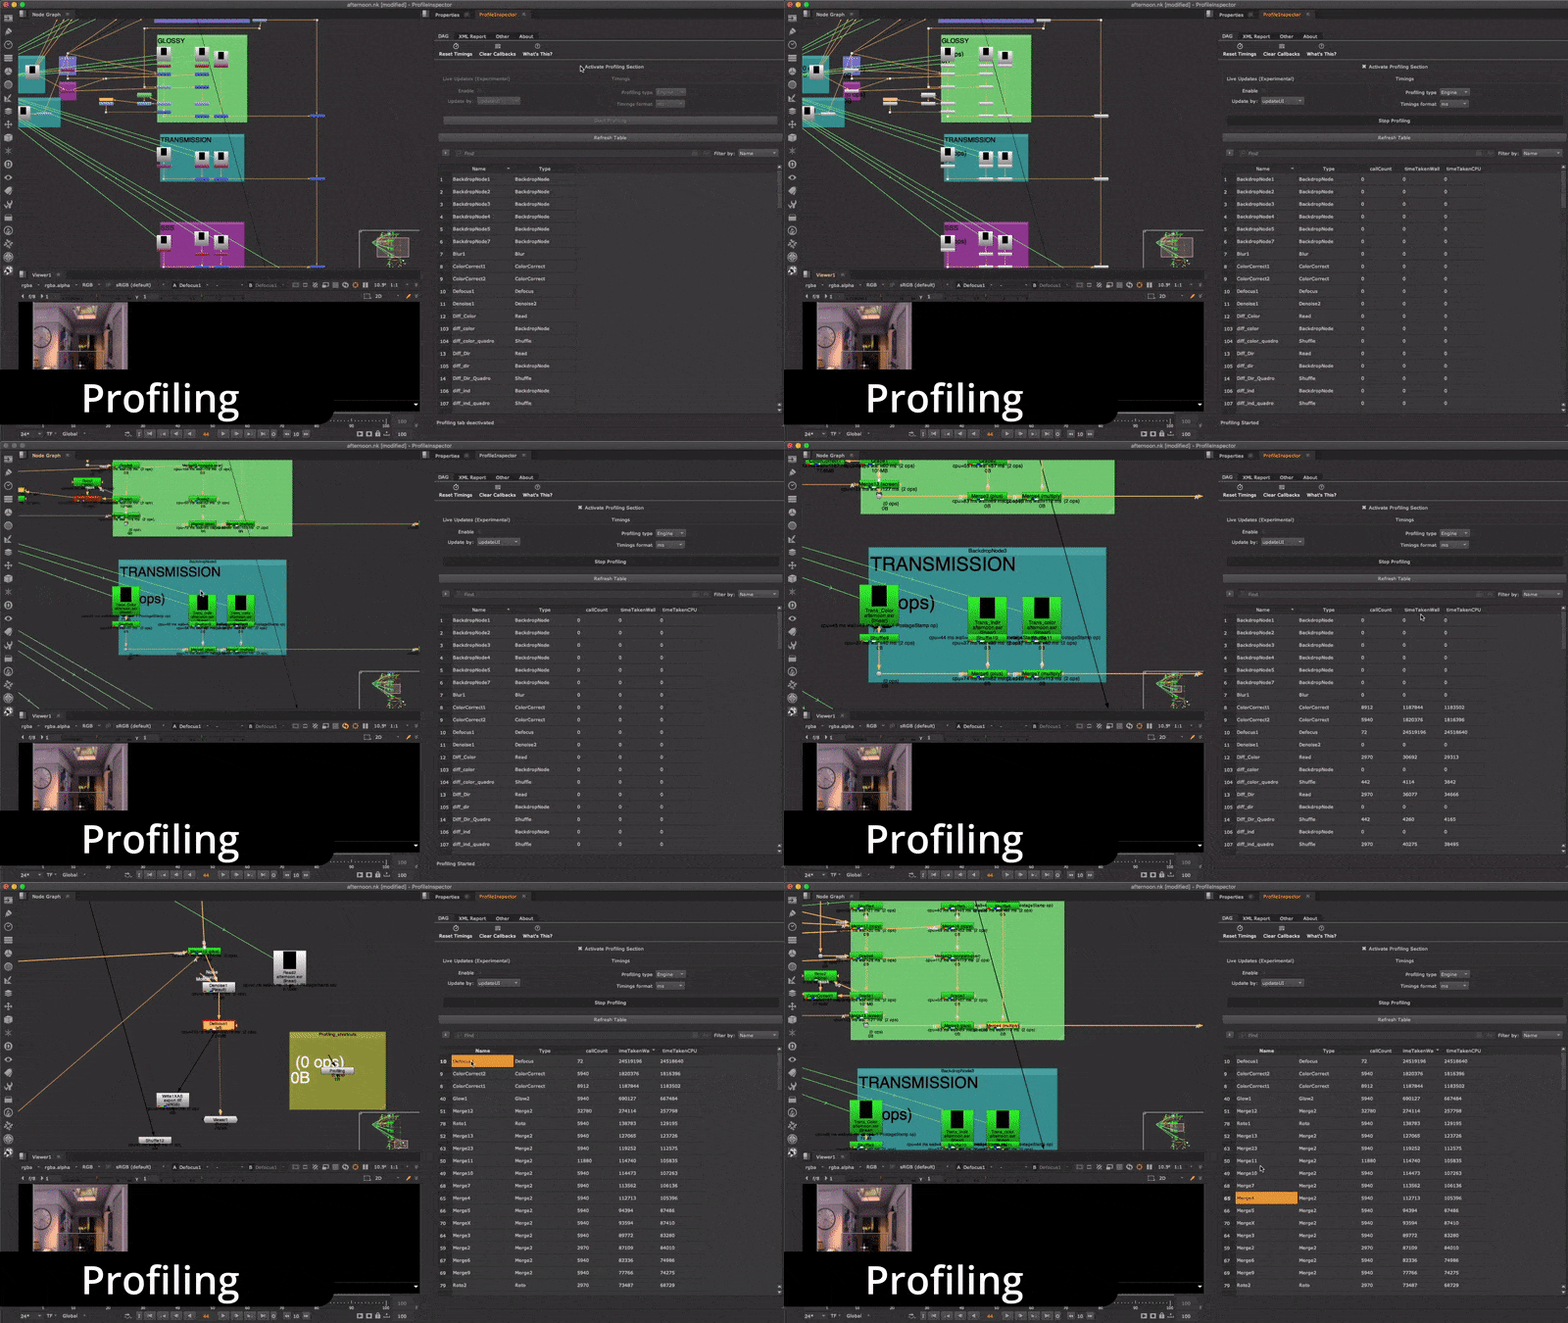
Inspect profiling information.
The basic idea is that you can take a snapshot of the current node's timings by refreshing the table. So each time there is a change in the timings, you need to do a new refresh.
- Activate the profiling section by clicking on the Activate Profile Section checkbox. This action will enable some subsections and show the node's profiling timings which are likely to be at 0 if it's the first run.
- Now you can start the profiling by clicking on the Start Profiling button. You can update the timers with the shortcut U which will trigger the image recalculation or by adjusting some node parameters.
- Now you can refresh the table again and save a snapshot of the current timings (timings will stay in the table even if you stop the profiling listener).
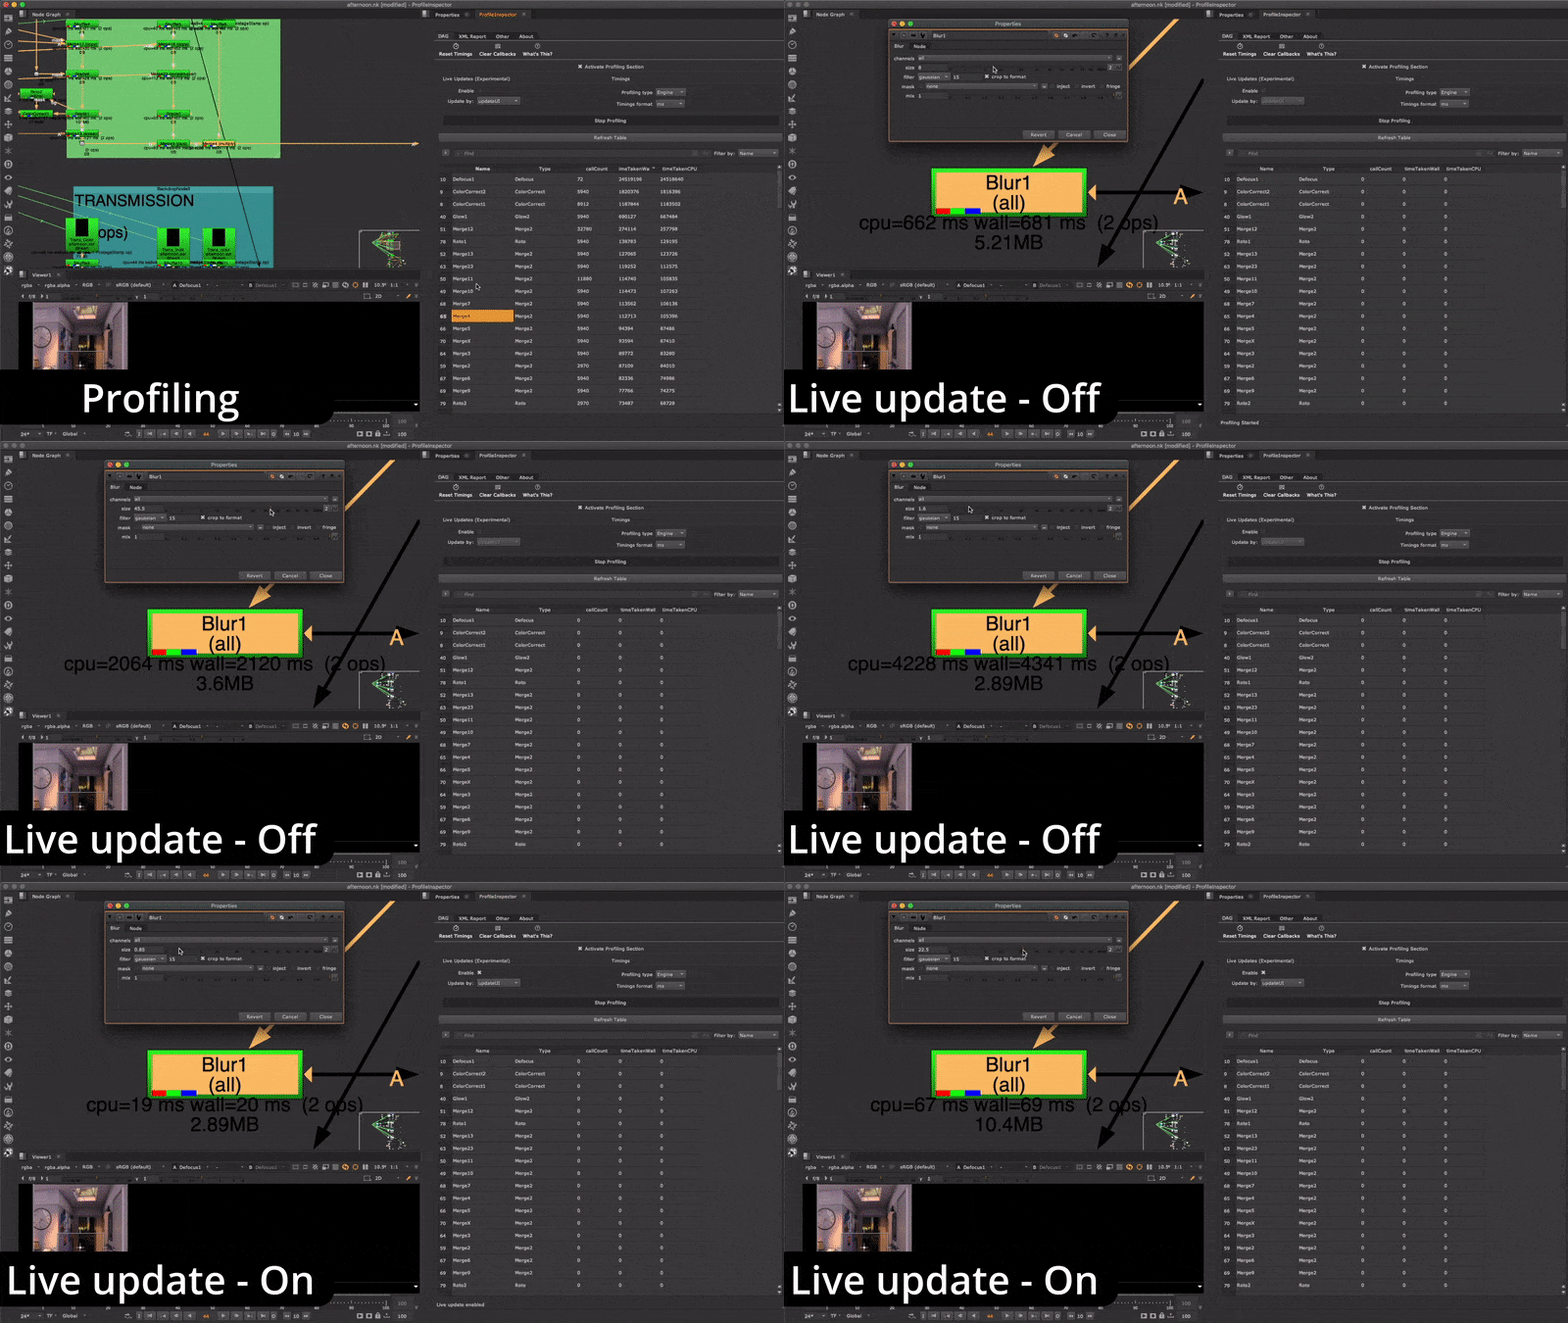
- Bonus. Enable Live update and find a node to tweak. Once done, retake a snapshot by refreshing the table.
When Nuke starts, if the table is empty, you can refresh it by clicking the Refresh Table button. This action will take a snapshot of the current nodes present in the graph.

1.3.2. XML Report
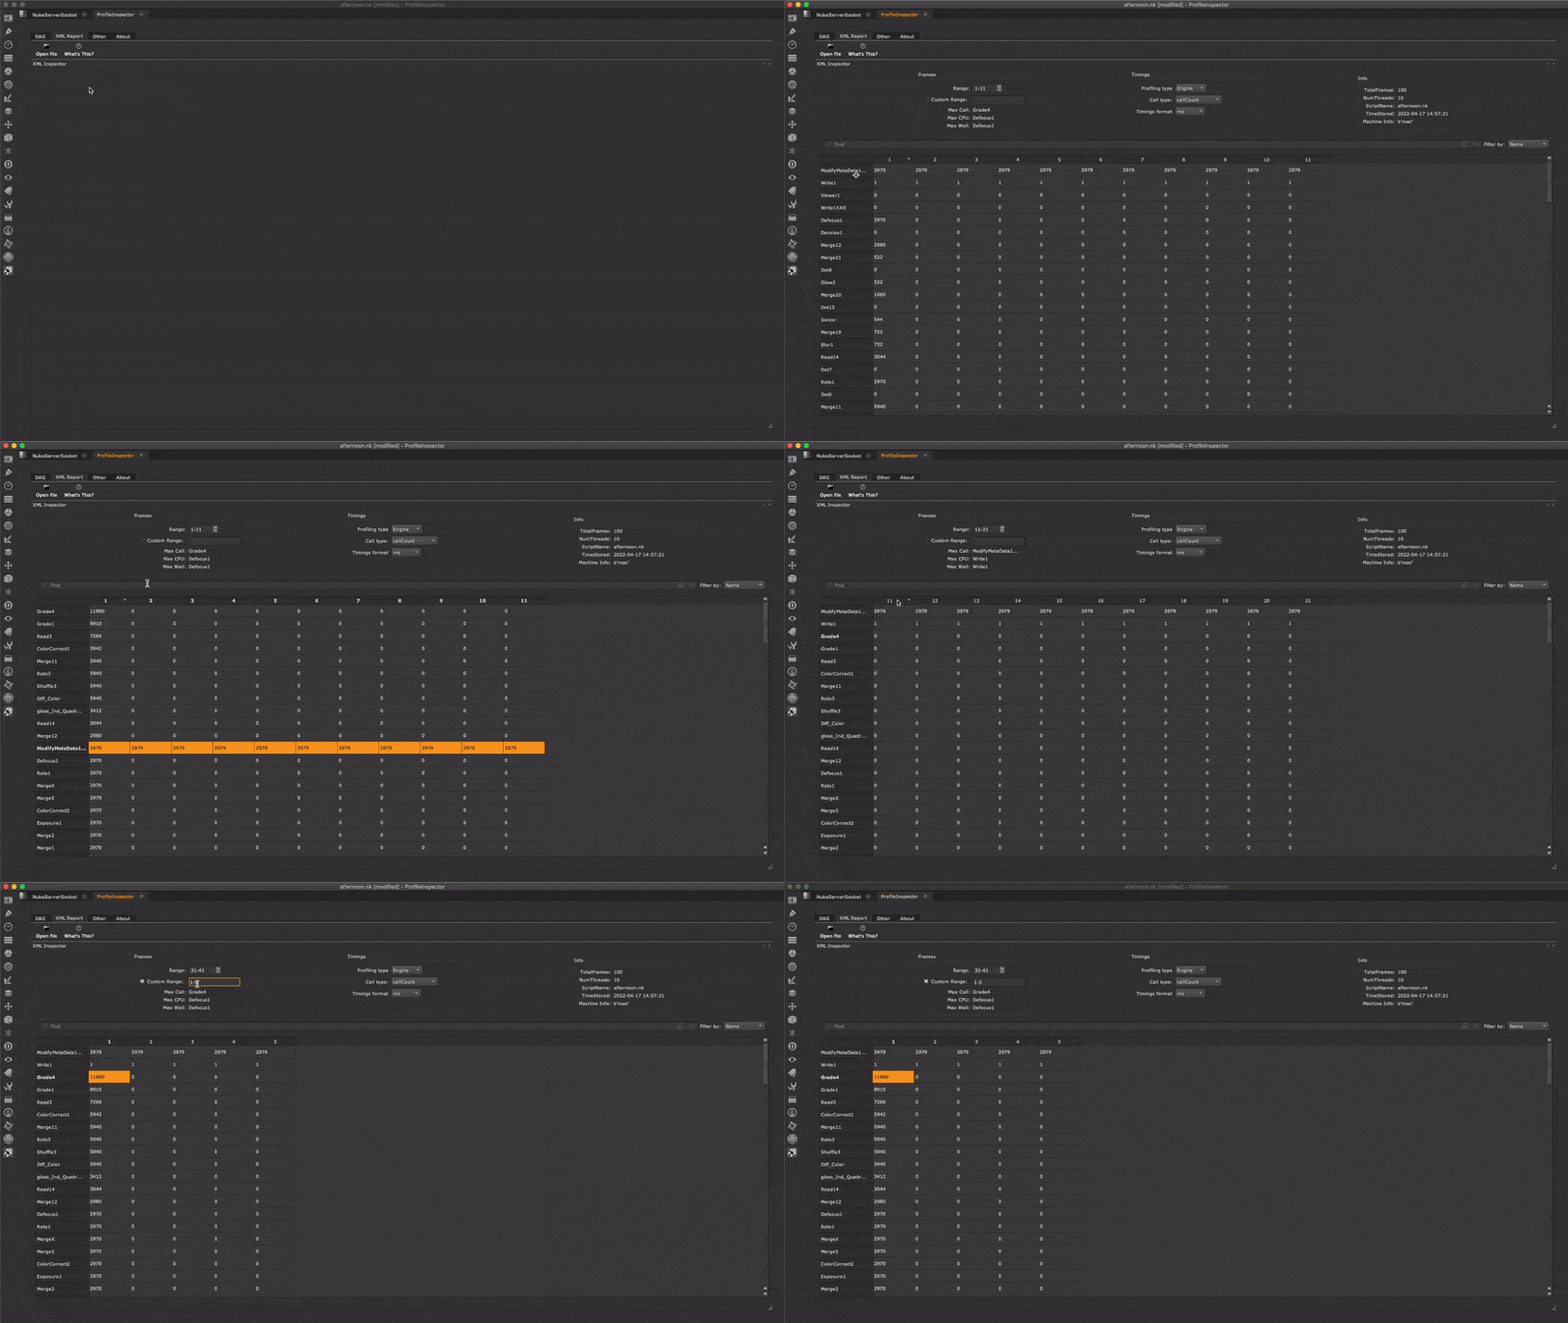
The XML Report tab can import a Nuke-created XML profile file generated from the nuke -Pf CLI arguments.
Like the DAG table, you can filter nodes, change the profiling timings, etc.
Usage
- Open a valid XML file created by Nuke.
- Use the table to analyze the information.
The window can also be un-docked (see dock windows for more info).

1.3.3. Nuke Launcher
The Other tab offers a convenient way to launch a new Nuke instance with the profiler listener activated.
This method is equivalent to launching Nuke via the terminal:
Some of the options available are:
- Specify the Nuke executable (by default, it will use the one currently running the instance)
- Specify the Nuke composition to launch.
- Specify the mode in which to launch Nuke (NukeX, NukeStudio, etc.)
- Capture the new instance output in a dockable window. (see dock windows for more info).
- Add optional arguments to the execution.
1.4. Extras
1.4.1. Live Update
Based on my experience with other software, when I work on a single frame, I use the profiling to understand how 'heavy' something is with the current parameters settings.
But Nuke doesn't work in that way. It keeps accumulating the timings even if the settings are turned to 0, i.e., just by moving the knob parameters up and down, the timers will increment regardless if you are using 100% or 1% of a specific parameter.
So the idea behind the live update is that; at each node parameter change, a callback will be triggered (via either updateUI or knobChanged), and the profiling timers will reset. Theoretically, in this way, you should see what the node is actually 'consuming' with the current parameters settings.
If you have some insights, please let me know.

1.4.2. Dock Windows
This feature is a leftover prototype, and I might remove it in future updates.
Much like the floating panel in Nuke, certain windows can be undocked for convenience.
To dock/un-dock simply double click on the window titlebar, drag the window or use the apposite buttons.

1.5. Compatibility
Nuke version: 11,12, 13.
Because Nuke 11 uses an early version of PySide2, future compatibility is not a guarantee.
While it should work the same on all platforms, I have tested the plugin only on:
- Linux:
- CentOS 8
- macOS:
- Mojave 10.14.06
- Catalina 10.15.07
- Windows 10
1.6. Test plugin locally
This works only on Linux and Mac. Probably Windows WSL, but I did not try.
While limited in some functionality, the plugin work outside the Nuke environment.
- Clone the GitHub repo into your machine.
pipenv install --ignore-pipfilefor a regular installation orpipenv install --ignore-pipfile --dev -e .if you want to test the code withpytest(Currently, no tests are present)- Launch the app via terminal
python -m tests.run_appor vscode task:RunApp.
Also, the plugin offers a simple emulation of the Nuke's internal modules inside ProfileInspector/src/_nuke/fake_nuke.py.
 - over 1,000 free tools for The Foundry's Nuke